Optimizing the London Restaurant Industry with NLP and Big Data Insights from Google Maps Reviews
In my dissertation project, I utilize the Google Maps API, Natural Language Processing and Big Data Techiques to analyze restaurant reviews in London. By examining both quantitative and qualitative data, I uncover valuable insights for economic observers, restaurant owners, and customers alike. This analysis offers a procedural framework for deriving meaningful conclusions from Google Maps reviews, benefiting various stakeholders in the restaurant industry.
Disclaimer: The purpose of this project is to focus on academic pratice, not for economic or trading purposes. The information provided is approximate and not 100% accurate. Because the data used in this project was collected in June 2023,
To view coding of this project, please follow this link.
Note: Please, click on the below images to view them with better clarity.
I. OBJECTIVES:
- To analyze restaurant distribution patterns in London, which contribute to a deeper understanding of the city's culinary geography
- To identify key factors driving positive and negative reviews, which can uncover recurring themes and aspects that significantly shape customer perceptions and influence their ratings.
II. PROCEDURE:
2.1 Data Collection:
- Obtain and integrate a Google Maps API key to authenticate requests.
- Read 3 lists of queries from a text file for flexibility (one mimicking user behavior with diverse keywords, another using specific region names, and a third using postal codes for comprehensive coverage). Click the link to see querries.
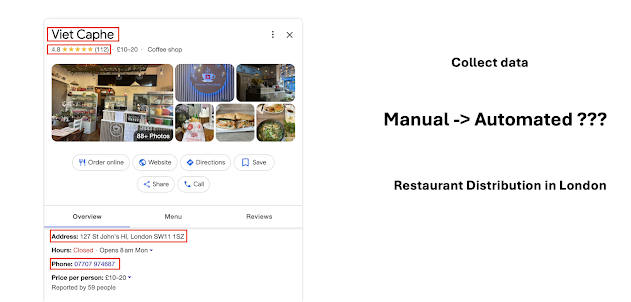
- Make iterative API requests to retrieve restaurant details, including: Restaurant Name, Address, Average Rating, Number of Ratings, User, Review, Review Rating, and Time
- Implement error handling to ensure the script could continue processing queries despite any exceptions.
- Store the retrieve data in a Pandas DataFrame and export it to an Excel file for easy access.
Click here to view coding for data collection
2.2 Data Pre-processing
- Combine 3 datasets retrieved from Google Map API (view coding)
- Remove duplicate reviews (view coding)
- Extract postal codes from variable “Address” and convert to region names (view coding, the third cell)
- Generate Unique IDs were for restaurants and users (view coding, the fourth cell)
(view dataset after pre-processing)
- Split dataset into quantitative and qualitative subsets for analysis
2.3. Quantitative Analysis:
- Analyze the distribution of restaurants across different regions in London
- Calculate the average ratings for each region
- Investigate the correlation between review length and rating
- Identifie the most popular restaurants based on the number of ratings
- Analyse distribution of numbers of reviews and average ratings
(view coding for quantitative analysis part)
2.4. Qualitative Analysis:
- Split long reviews into single sentences by using natural language processing.
- Perform sentiment analysis on each single sentences by using the VADER tool.
- Generate WordClouds to visualize the most frequently used words in positive and negative sentences.
(view coding for qualitative analysis)
2.5. Categorization Algorithm:
- A custom algorithm was developed to categorize reviews into dimensions like food quality, service, ambiance, and price.
- This categorization process involved text pre-processing, keyword extraction, category definition, and category assignment.
- The categorized data was analyzed, and category-specific insights were generated for individual restaurants.
Click here to view coding
III. FINDINGS
3.1.2. Regional Average Ratings:
The graph shows the average ratings by region for a product or service. The North region has the highest average rating of 4.34, while the North East region has the lowest at 4.18. The ratings are relatively consistent across regions, with a difference of only 0.16 between the highest and lowest.
3.1.3 Correlation between Review Length and Rating:
A negative correlation (-0.187) was found between review length and review rating. Longer reviews tended to be associated with lower ratings, while shorter reviews were linked to higher ratings. This finding implies that customers who write lengthier reviews may do so to express dissatisfaction or to provide more extensive feedback on negative experiences. Conversely, customers who leave shorter reviews may be more inclined to rate their experiences positively or have less to critique.
The data shows a predominantly positive rating distribution, with an average star rating of 4.24 out of 5. The majority of ratings fall within the 3 to 5-star range. In the analysis of customer engagement and feedback, a clear pattern emerges when considering a restaurant's average number of ratings alongside its overall rating score. High-rated restaurants tend to have a significant number of reviews, indicating positive experiences. Conversely, lower-rated ones struggle to attract customers and receive fewer reviews, often signaling issues with food or service.


.png)
Comments
Post a Comment